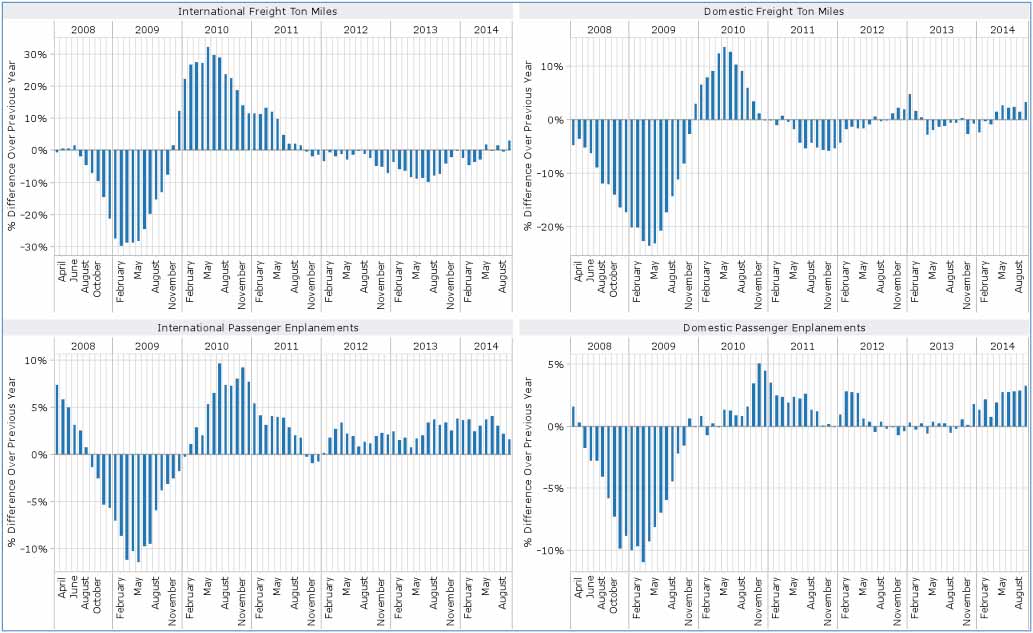
TFI monitors airline performance across the world. In the chart below the change against the previous year is shown for the international (left hand side) and domestic airlines (right hand side) in the USA. The upper charts show the performance for freight (change in freight ton miles), and the lower charts the performance for passenger traffic (change in passenger enplanements).
Note that there appears to have been a recovery in freight performance over the past 12 months in the USA for both the international and domestic sectors. The passenger market has also improved for both the international and domestic sectors.
US Air Traffic Performance, Change Against Previous Year
for Rolling Quarters March 2008 to September 2014